Inlägg

Oil, Blood, Sweat and Tears

Bild
30-second summary: We emitted more CO2e than ever in 2018.  Heat waves in Europe with higher temperatures than the disastrous heat wave in 2003.  Heat wave and severe water shortage in India that will worsen the coming years.  Heat waves are predicted results of global heating. The Strait of Hormuz is essential for oil supply. Anyone who controls it will control the world economy. US are deploying troops and amphibious assault ships to that region. Is that a threat or preparations for war against Iran? 660k Swedish Facebook users are opposing high petrol prices. The group has addressed an urban-rural conflict area, and might defer politicians from tackling global heating. When I started this blog, I wanted to avoid discussing current events and focus on slower and more profound changes in the world we live in and the lives we will be able to live. This blog post will be an exception and I will discuss some recent events. Oil - BP's Statistical Review of Global ...

Oil: Orinoco Flow, Dirty Sand and Thirsty Empires

Bild
20 Second Summary: Three out of five of the worlds largest economies (EU, Japan and India) have almost no oil reserves. China are currently importing most of its oil, and USA will need to import most of its oil very soon. The demand of oil is rising and the supply will eventually fall.  I expect price shocks  and shortage of oil and oil-related products. Price shocks for oil will not save the climate - there is enough of oil, natural gas and coal to reach 450 ppm and above.  Peak-oil is a second strong reason to stop wasting our resources and to stop heating our planet. Oil Reserves, Consumption and  Production  Recovery In this post, I will investigate the supply and demand of oil for different regions of the world. I'll start with listing the countries with the biggest  GDP, reserves, production and consumption respectively. GTOE is a billion tonnes of oil equivalents and MTOE is a million of oil equivalent. The five largest  economies ...

Oil: Economy of Oil

Bild
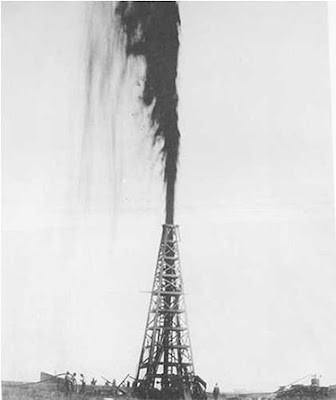
Summary: We will not run out of oil. But we will run out of cheap oil and the oil "production" will drop because of this. It is getting more expensive to extract oil over time and eventually oil will be too expensive to extract. In the last blog post, I discussed how much oil we have, how much "new" oil we find and how much oil we consume. To understand this, it is essential to understand the economy of oil and the theory of peak-oil . Economy of Oil - EROI When one decides whether or not to extract oil from an oil field, one will consider how much effort is needed and how much returns one can expect. The specific energy of crude oil is 11.6 kWh per kg and that is the upper limit of the efforts one would put in to get oil - it would be much more energy efficient to take a nap than to spend 12 kWh of energy to get 11.6 kWh of energy. One of the first towers of the Spindletop oil field in the early 20th century . Initially, it is easy to extract oil (hig...

Energy: Rubberducking Oil

Bild
When I digged into the numbers for this blog post, I found some of my misunderstandings about our relation to oil: Renewable energy is replacing fossile fuels: False Globally, the share of renewables increased by 14% between 2016 and 2017 (an increase of almost 70 Million Tonnes of Oil Equivalents). The global share of fossile fuels decreased slightly from 85,5% to 85,18%. But the total supply of fossile fuels increased by almost 180 MTOe. Fossile fuels is growing more than twice as much as renewables! This is a school-book example of why it is important to distinguish absolute increases from percent-wise increases. Sweden has phased out fossile fuels and is a role model for the world : False. Sweden imports some 10 million tonnes of oil per year - one tonne per person. The global consumption is 4.5 billion tonnes per year -  600 kg per year and person. Nope. Looking at the oil reserves, this is bad news. I'll start discussing why without mentioning Global Warming in th...

Reducing My Emissions

Bild
Here is an update on my New Years resolution. Using a spreadsheet that is inspired on Klimatkontot , I note my consumption of housing, travels, food and commodities on a weekly basis. I calculate relevant sums or averages of that consumption and I use that when updating Klimatkontot. For the February report, two months are facts and the rest is predictions. The blue rows are the past weeks and the green row is the current week.  The future weeks are estimated to the average of the blue weeks. For food, I've added the annual CO2e emissions per weekly portion. Red meat such as lamb and beef is very CO2e-intense. Replacing with other meat (or preferably vegetarian food) will reduce the emissions a lot.  I fill in the consumption weekly for three reasons: I need to know my actual consumption, without any happy numbers or green-washing. I need to understand what actions are efficient in order to reduce my global warming footprint. I need an immediate feedback of my b...

Your Share of the Worlds Resources

Bild
A couple of months ago, I discussed how much land each of us would have, if the global land mass was distributed evenly. Now, I'll look at some important natural resources. Return of Investment When discussing resources and reserves, it is very important to distinguish them. I'll illustrate with an apple tree that provide me with apples to eat. The first apples that I pick are the big, juicy ones between one and two meters above the ground. Why those apples and not smaller, half rotten apples that lie on the ground or big apples five meters above the ground? The answer is Return of Investment . The effort (investment) of picking easily accessible, big and juicy apples is low and the returns are high. When all the low-hanging fruit is taken, I'll pick the slightly smaller and non-perfect apples. The returns are diminishing and thus the Return of Investment falls. Perhaps, I decide to go for the high-altitude apples, taking a risk of falling, buying a ladder or asking ...

Global Warming: Trying to Reduce Footprint

Bild
For 2019, my New Year's resolution will be to monitor my personal CO2e emissions and meet the 2030 target from IPCC . To reach the 1.5 degree target, the global emissions must be 45% lower, compared with 2010. By 2050, the emissions must be net-zero. Average Footprint The numbers for the average footprint are a bit confusing and some clarification is needed. A person (in Sweden for this example) emitted almost 11 tonnes of CO2e  in 2010. Almost 4,5 tonnes are produced in  Sweden and more than six tonnes abroad. The abroad emissions include imports, such as Brazilian beef, American/Chinese Iphones and holiday travels abroad. Most of the emissions from a person is from his/her personal consumption (7 tonnes 2010), but a fraction is from hospitals, police, schools, care of children and elderly (4 tonnes). I'll use the Swedish web site klimatkontot to calculate my personal emissions. Step 1: Measure Current Footprint. The first step is to understand how much I emitt...